Report on your Student Support Centre's impact
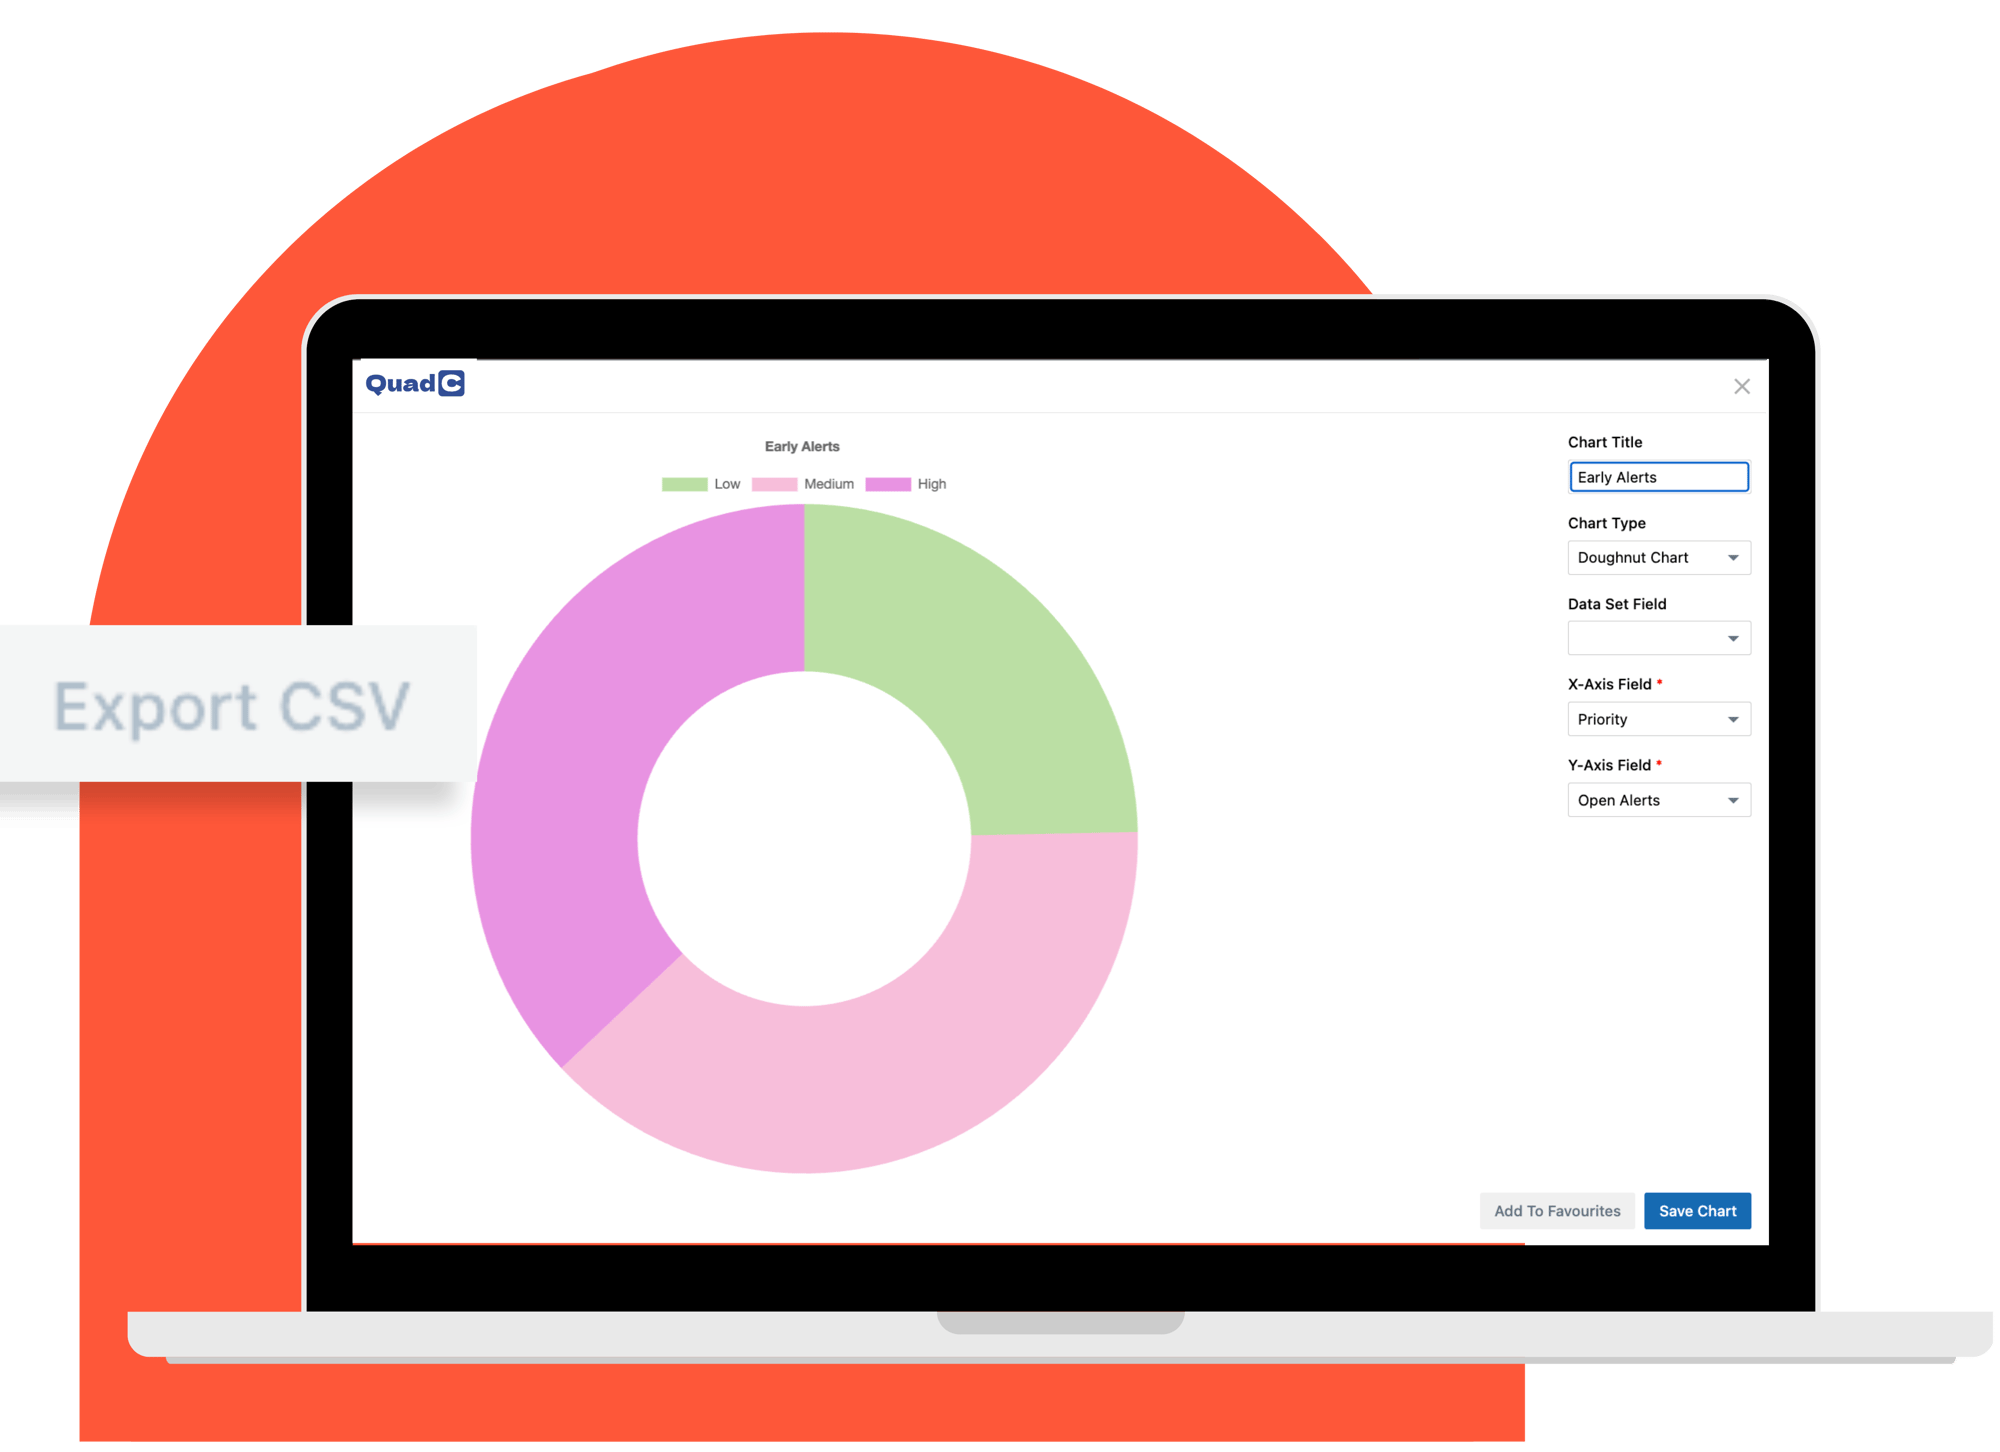
With QuadC's dashboard and advanced reporting features, you can easily access and share data that highlights your department's usage.
Trusted by leading institutions across North America






%20logo.png?width=500&height=250&name=Abraham%20Baldwin%20Agricultural%20College%20(ABAC)%20logo.png)

.png?width=500&height=250&name=maryville%20university%20logo%20(2).png)



.png?width=500&height=250&name=university%20of%20south%20carolina%20logo%20(2).png)
Get a snapshot of your centre's usage with the dashboard
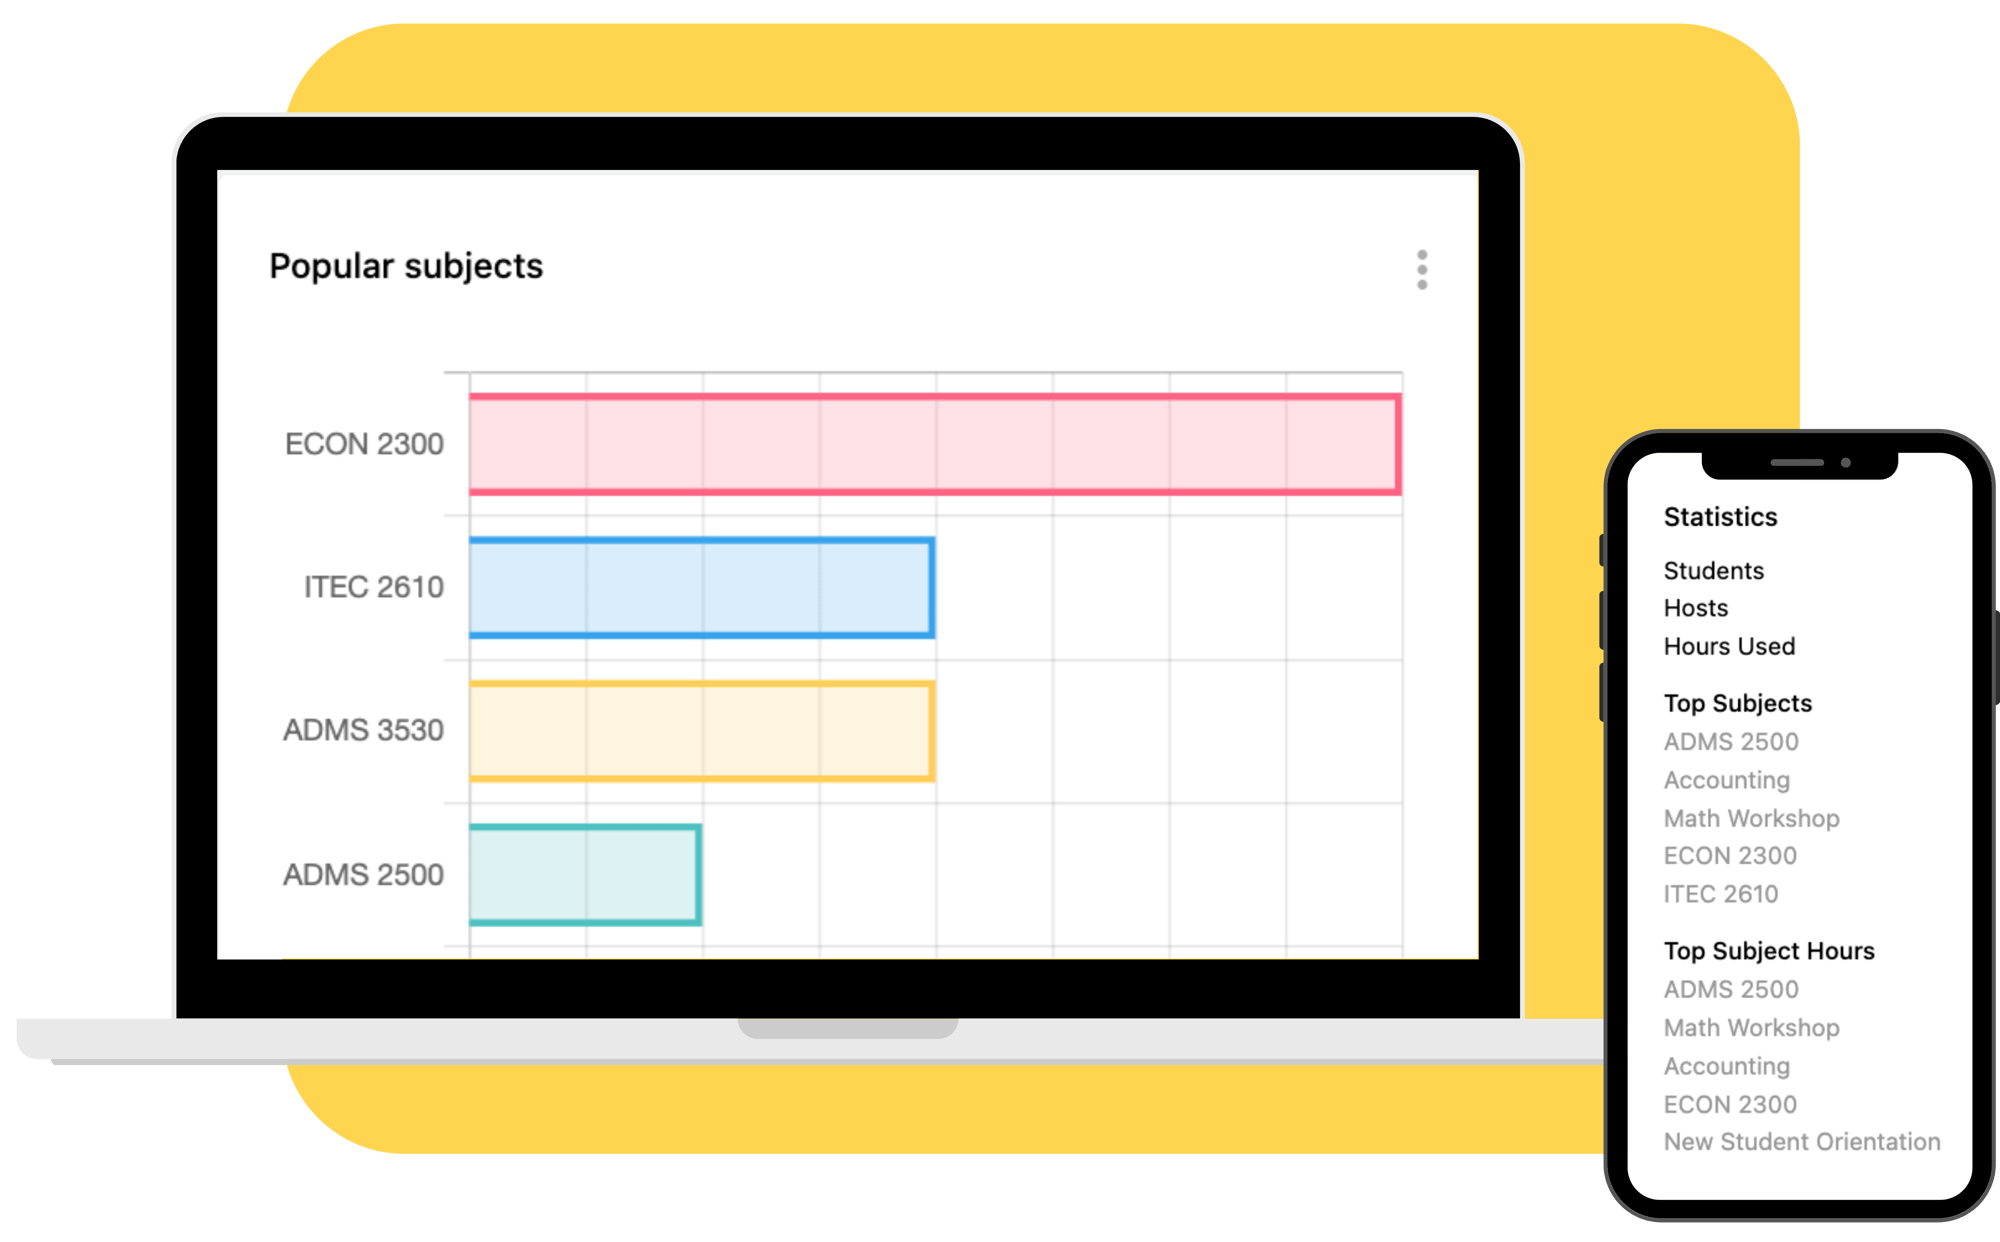
QuadC makes it easy for you to find and share data from the reporting dashboard. You can filter by department or campus and generate reports on:
- sessions or hours hours hosted
- hosts and students on the platform
- assignments and subjects
- open alerts (for Early Alerts clients)
- and more!
-1.png?width=2000&height=1241&name=reporting%20%20-%20dashboard%20(1)-1.png)
Keep stakeholders informed with shareable reports
Share relevant data with team members by managing their permissions or generating PDFs and CSV files that can be easily shared with other departments.
Highlight your department's impact with DFW Reports
QuadC allows you to generate a Drop Fail and Withdrawal (DFW) Report so you can compare average grades of those who use your student services to those who do not.

Manage resourcing with efficiency reports
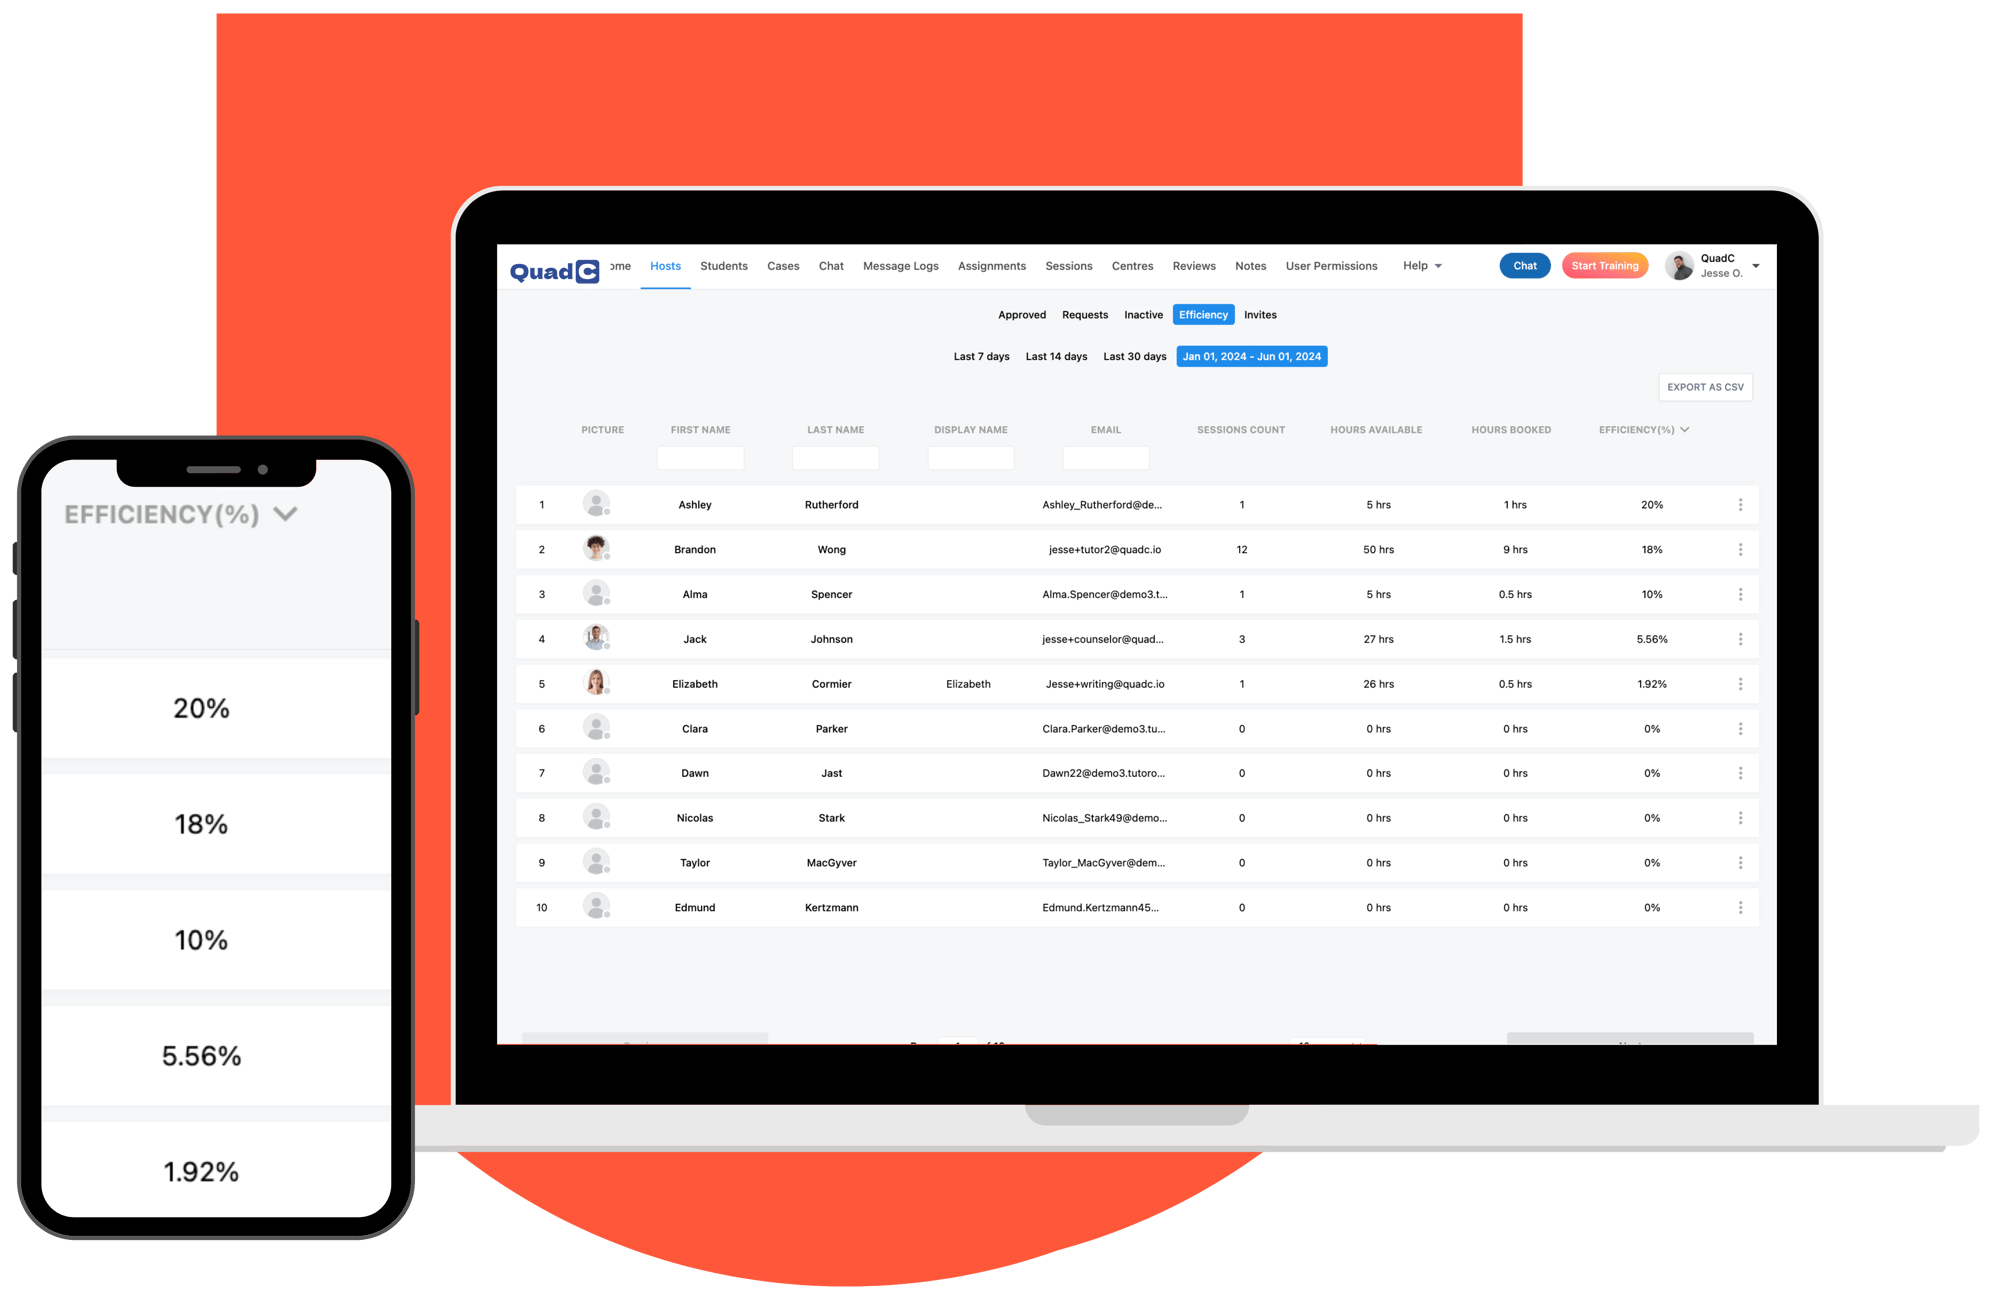
QuadC's Efficiency Reports showcase the number of hours available to students per host (tutor, advisor, etc.) compared to the number hours booked.
Access demographic and classroom insights
Because QuadC integrates with your schools's Student Information System (SIS) and Learning Management System (LMS), you can monitor student success both inside and outside of the classroom.
Request a Demo
Our knowledgable team will walk you through the QuadC reporting features that allow you to measure your department's impact.